


From cells to dashboards: Data storytelling with Tableau

August 11, 2022 -
1:22 pm

TL; DR: Senior Tableau Developer, Slavi Chankov, gives professional guidance on one of the leading data visualization platforms, Tableau. This short blog will help you gain insight into the business logic of a data set and the best practices to create great data storytelling.
As a business intelligence developer with more than eight years of experience in the data world, my expertise is in data visualization, which has become my passion. For those wanting to start in the world of data, visualization is one of the most important roads. Because human beings are very visual, I find it very important to organize and present information in a way everyone understands.
One of the best tools available in the market for data visualization is Tableau. My advice for anyone wanting to become a data scientist or business intelligence developer is to use this powerhouse of a platform, either in public or desktop version, and any data set to begin playing with the data. In this blog post, I’ll share some of my knowledge on the topic to guide you through the basics of telling a story with data.
Contrary to most of our blog posts, this note is aimed at helping developers complete specific tasks within the platform. In this first Tableau blog post, we’ll go through the first steps and an overview of the webinar.
Getting prepared for data storytelling
I always encourage people to prepare their data with Snowflake, a Blankfactor partner and the best data clouding tool available on the market. Snowflake provides a free, one-month trial, which is great for anyone to get acquainted with concepts such as data warehousing, data lakes, and cybersecurity. Snowflake offers sample datasets to play with data warehouses and get a clear hold of the field.
Why do I recommend Snowflake when using Tableau? For starters, Snowflake considers Tableau as its go-to platform for BI and data visualization. Once you open a Snowflake account and upload a data set, you can import your data and profile on Tableau Public or a trial version of Tableau Desktop.
To connect both environments, select the Snowflake connector available in Tableau and indicate the server name, username, and password.
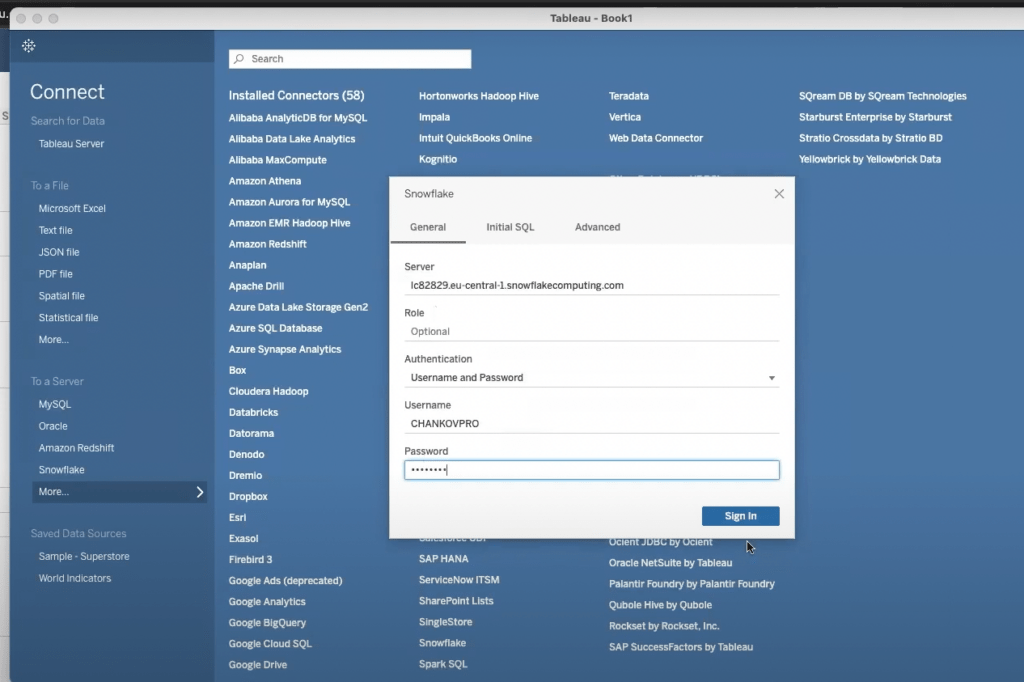
A successful connection will allow dragging and dropping the schema on which you wish to work. If you’re just starting, I recommend using a flat file, such as .XLSX or .CSV. Once that flat file is imported, it’s best to take a few minutes to play around with it and navigate the different menus.
Tableau allows the selection of more than one table and makes connections between the data. However, for this specific example, we’re sticking with only one table.
The origins of a story
At the bottom of the screen, several tabs display different options: “Worksheets,” “Dashboards,” and “Stories.”
![]()
Use worksheets to create dashboards, and dashboards to generate data stories. However, you can work on each element whichever way you prefer. For example, it’s possible to create and publish a worksheet on Tableau Public without having generated a dashboard for it.
This example focuses on dashboards and worksheets only. Simplicity is key when creating your first dashboard. At first glance, users should be able to understand what’s going on and gather the most important information. You can select the main KPIs for a company or organization, as well as any relevant data users require first-hand. In my case, I chose “Profit,” “Sales,” “Profit to Sales Ratio,” “Average Discount,” “Quantity,” and “Number of Orders.”
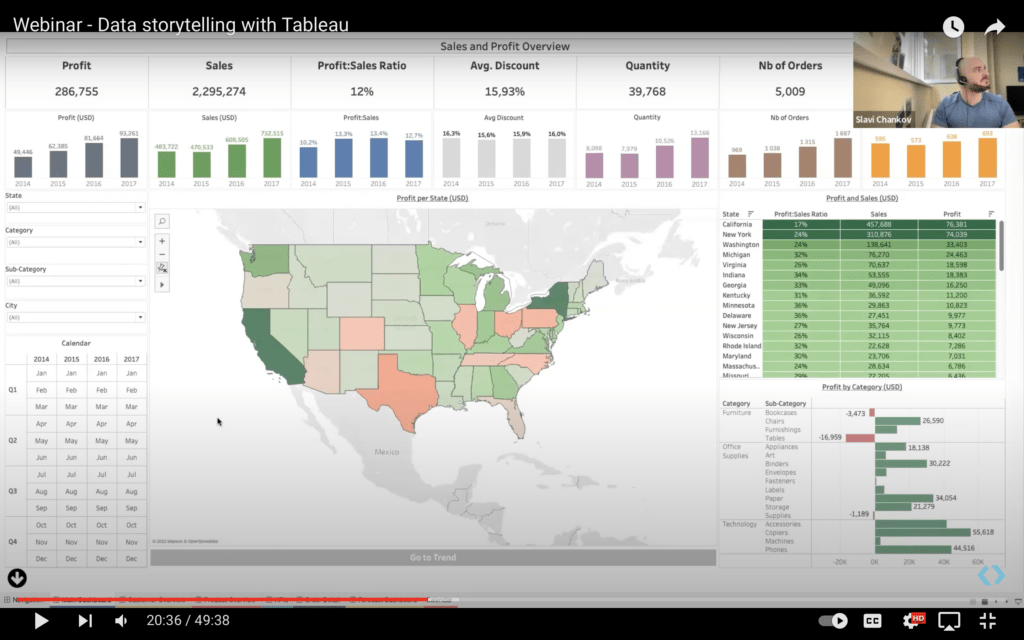
Dashboards should be simple. For teaching purposes, it’s best to show all the information we have on a single screen.
One of the most practical aspects of a dashboard is the ability to filter according to specific criteria, such as category, sub-category, and city. By hovering over differing tooltips, users can gather different bits of information. What was the company’s profit in 2017, and how does it compare to other years? You no longer require to spend hours rummaging through an Excel sheet; everything a user needs is available on a single screen. Organizing the information is up to you.
What happens if we want to show quarterly data? That’s no problem at all. Organize data into smaller pieces and add additional filters. This action helps users to click and analyze any aspect they wish to explore.
The beauty of data storytelling
One of the aspects I enjoy the most about Tableau is its ability to turn countless rows of data into a clickable dashboard. Instead of spending hours on an Excel sheet, users can gather the most relevant ideas by interacting with dashboards for a few minutes.
The best thing about a Tableau dashboard is how easy it is to work. For example, to create a map, make sure you’ve uploaded a worksheet for that purpose. In my case, you can see a worksheet called “Map,” and once you click on it, you can see all the different variables. The best exercise you can do on your own is reverse engineering an existing dashboard, play with the data and functions, and find out how everything works.
However, if you’re looking to create a map from scratch, you can do so by following the next steps:
- In a new worksheet, select the data types you wish to showcase. These are available under the “Tables” column on the left-hand side.
- Tableau classifies each data type with a clickable icon, allowing the selection of the different measures for a map. Select the data types, dimensions, and measures to be featured.
- On the right-hand side, click on the type of graph to begin working on your map.
- Once the map has been generated, Tableau places a dot over every country or state. To change the color coding, choose a variable and drag it to the color panel.
- To add more information when the user hovers over a region, all you have to do is drag the variable to the marks panel.
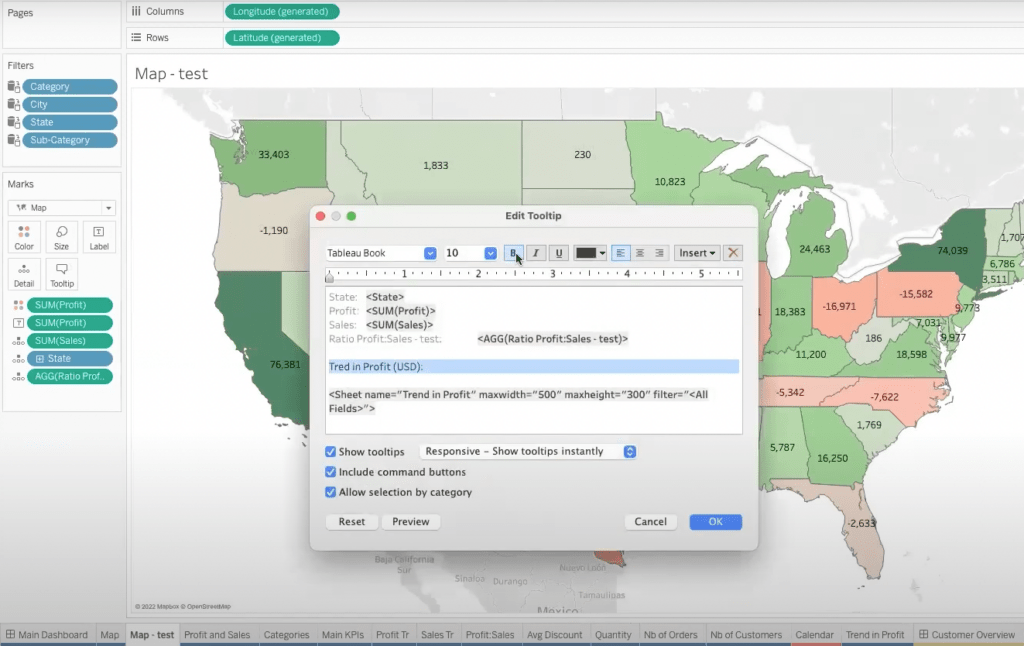
- You can put the different variables in the mark types to bring the sheet visualization of figures or text. Another insightful way to show your data is by creating a separate sheet. You can add a reference to it in the tooltip text. The steps are shown below. In the tooltip, we click Insert, and we choose the sheet we want to visualize with width and height measurements.
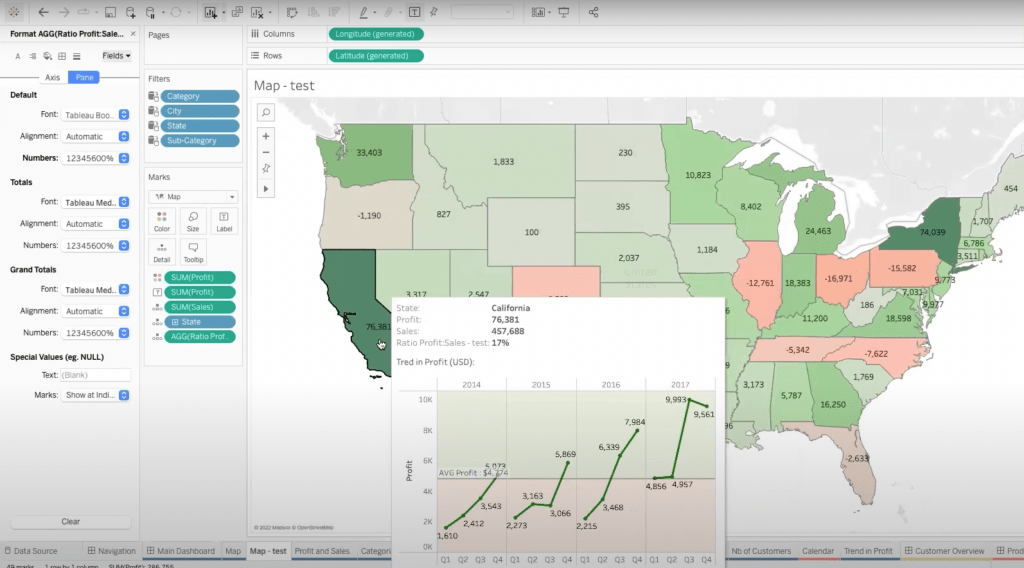
And the result:
There are many other visualizations you can create using a single flat file. To learn more about how to tell a story with data, click on the webinar I hosted last month or on the following links to begin your data journey.
We hope this information has been useful for you and your business. Spending a few hours tinkering with data sets can open new opportunities. So, what are you waiting for to start your data visualization journey?
To begin, you can download the .CSV and Tableau working file here.
This is the first blog post of many which will go through the detailed way of developing different visuals, calculations, and insights on your data. Stay tuned to our site, social media, and blog posts!
Was this article insightful? Then don’t forget to look at other blog posts and follow us on LinkedIn, Twitter, Facebook, and Instagram.
Author
Related posts